
Digital Storytelling · Parsons MS Thesis
Louis Armstrong in Data and Song
Designer & Developer · Timeframe: 3 months · Collaboration with The Louis Armstrong House Museum
Overview
More than an entertainer — a cultural ambassador who shaped American identity
This project is my Master's thesis for the MS in Data Visualization at Parsons School of Design, presented at the 2026 Keynotes. It brings greater attention to Louis Armstrong's role as a cultural ambassador by examining how his career helped carry jazz and American culture across the world. Through data and archival research, it argues that Armstrong was more than an entertainer. He was a central figure in the making of modern American cultural identity at home and abroad.
Collaboration
The Louis Armstrong House Museum
Developed in close collaboration with the Louis Armstrong House Museum in Corona, Queens. The Museum opened its archives to me and provided historical expertise, guidance, and support through weekly meetings across the life of the project, shaping both the questions I asked and the data I was able to build from.
Approach
Data project first, design project second
I treated the data work as the foundation. I approached this as a data project first and a design project second. Using Python notebooks, I parsed and analyzed data pulled together from multiple sources: The Louis Armstrong House Museum archives, published discographies, and film records gathered from IMDb, cleaning and reconciling formats that were very different. From that analysis I produced structured JSON files: one clean data model per visualization, shaped specifically for what each view needed to show.
Only after that groundwork was complete did I move to design. Each visualization was built from its custom dataset, letting the structure of the data guide what stories could be told and how. This process meant the design decisions were informed by what the data could actually support.
Sketches to Design
Testing ideas on paper before committing them to code
Before writing any code, I sketched each visualization by hand. Working the ideas out on paper let me test which chart forms actually surfaced the story. Once a sketch earned its place, I designed and built that visualization from the JSON, iterating on the interaction of the visualization directly in the browser.
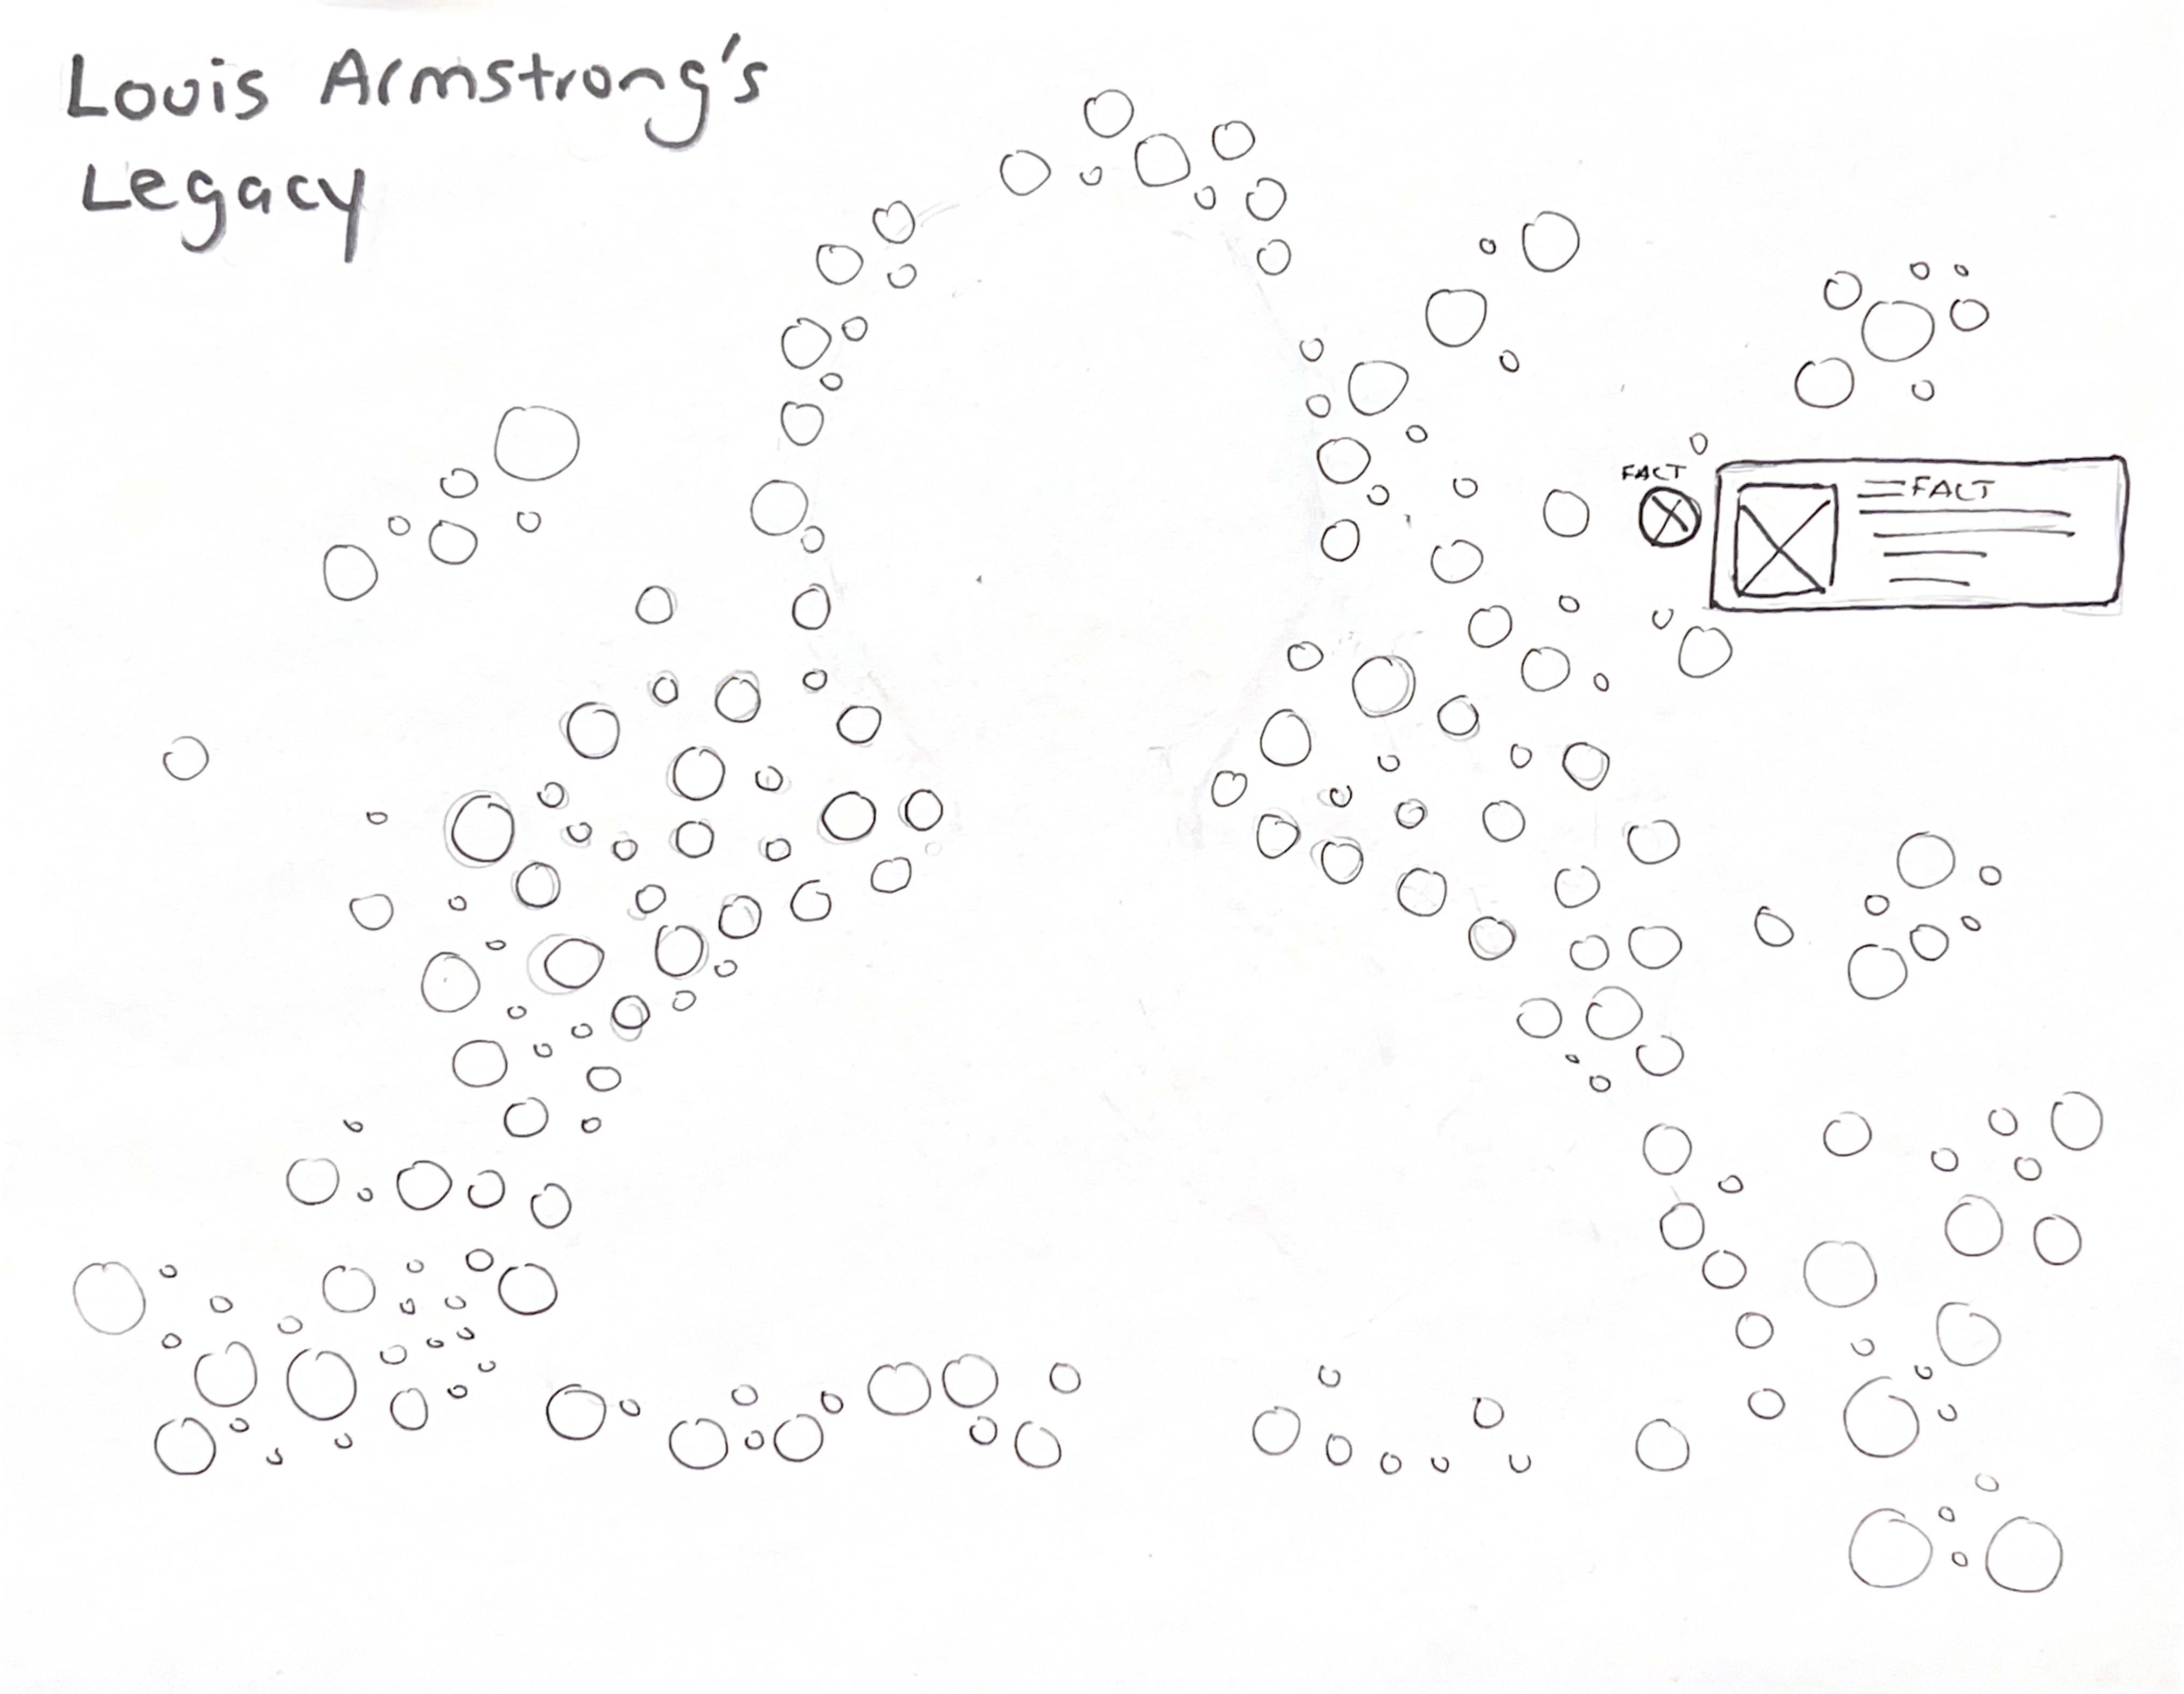
What a Wonderful World Sketch
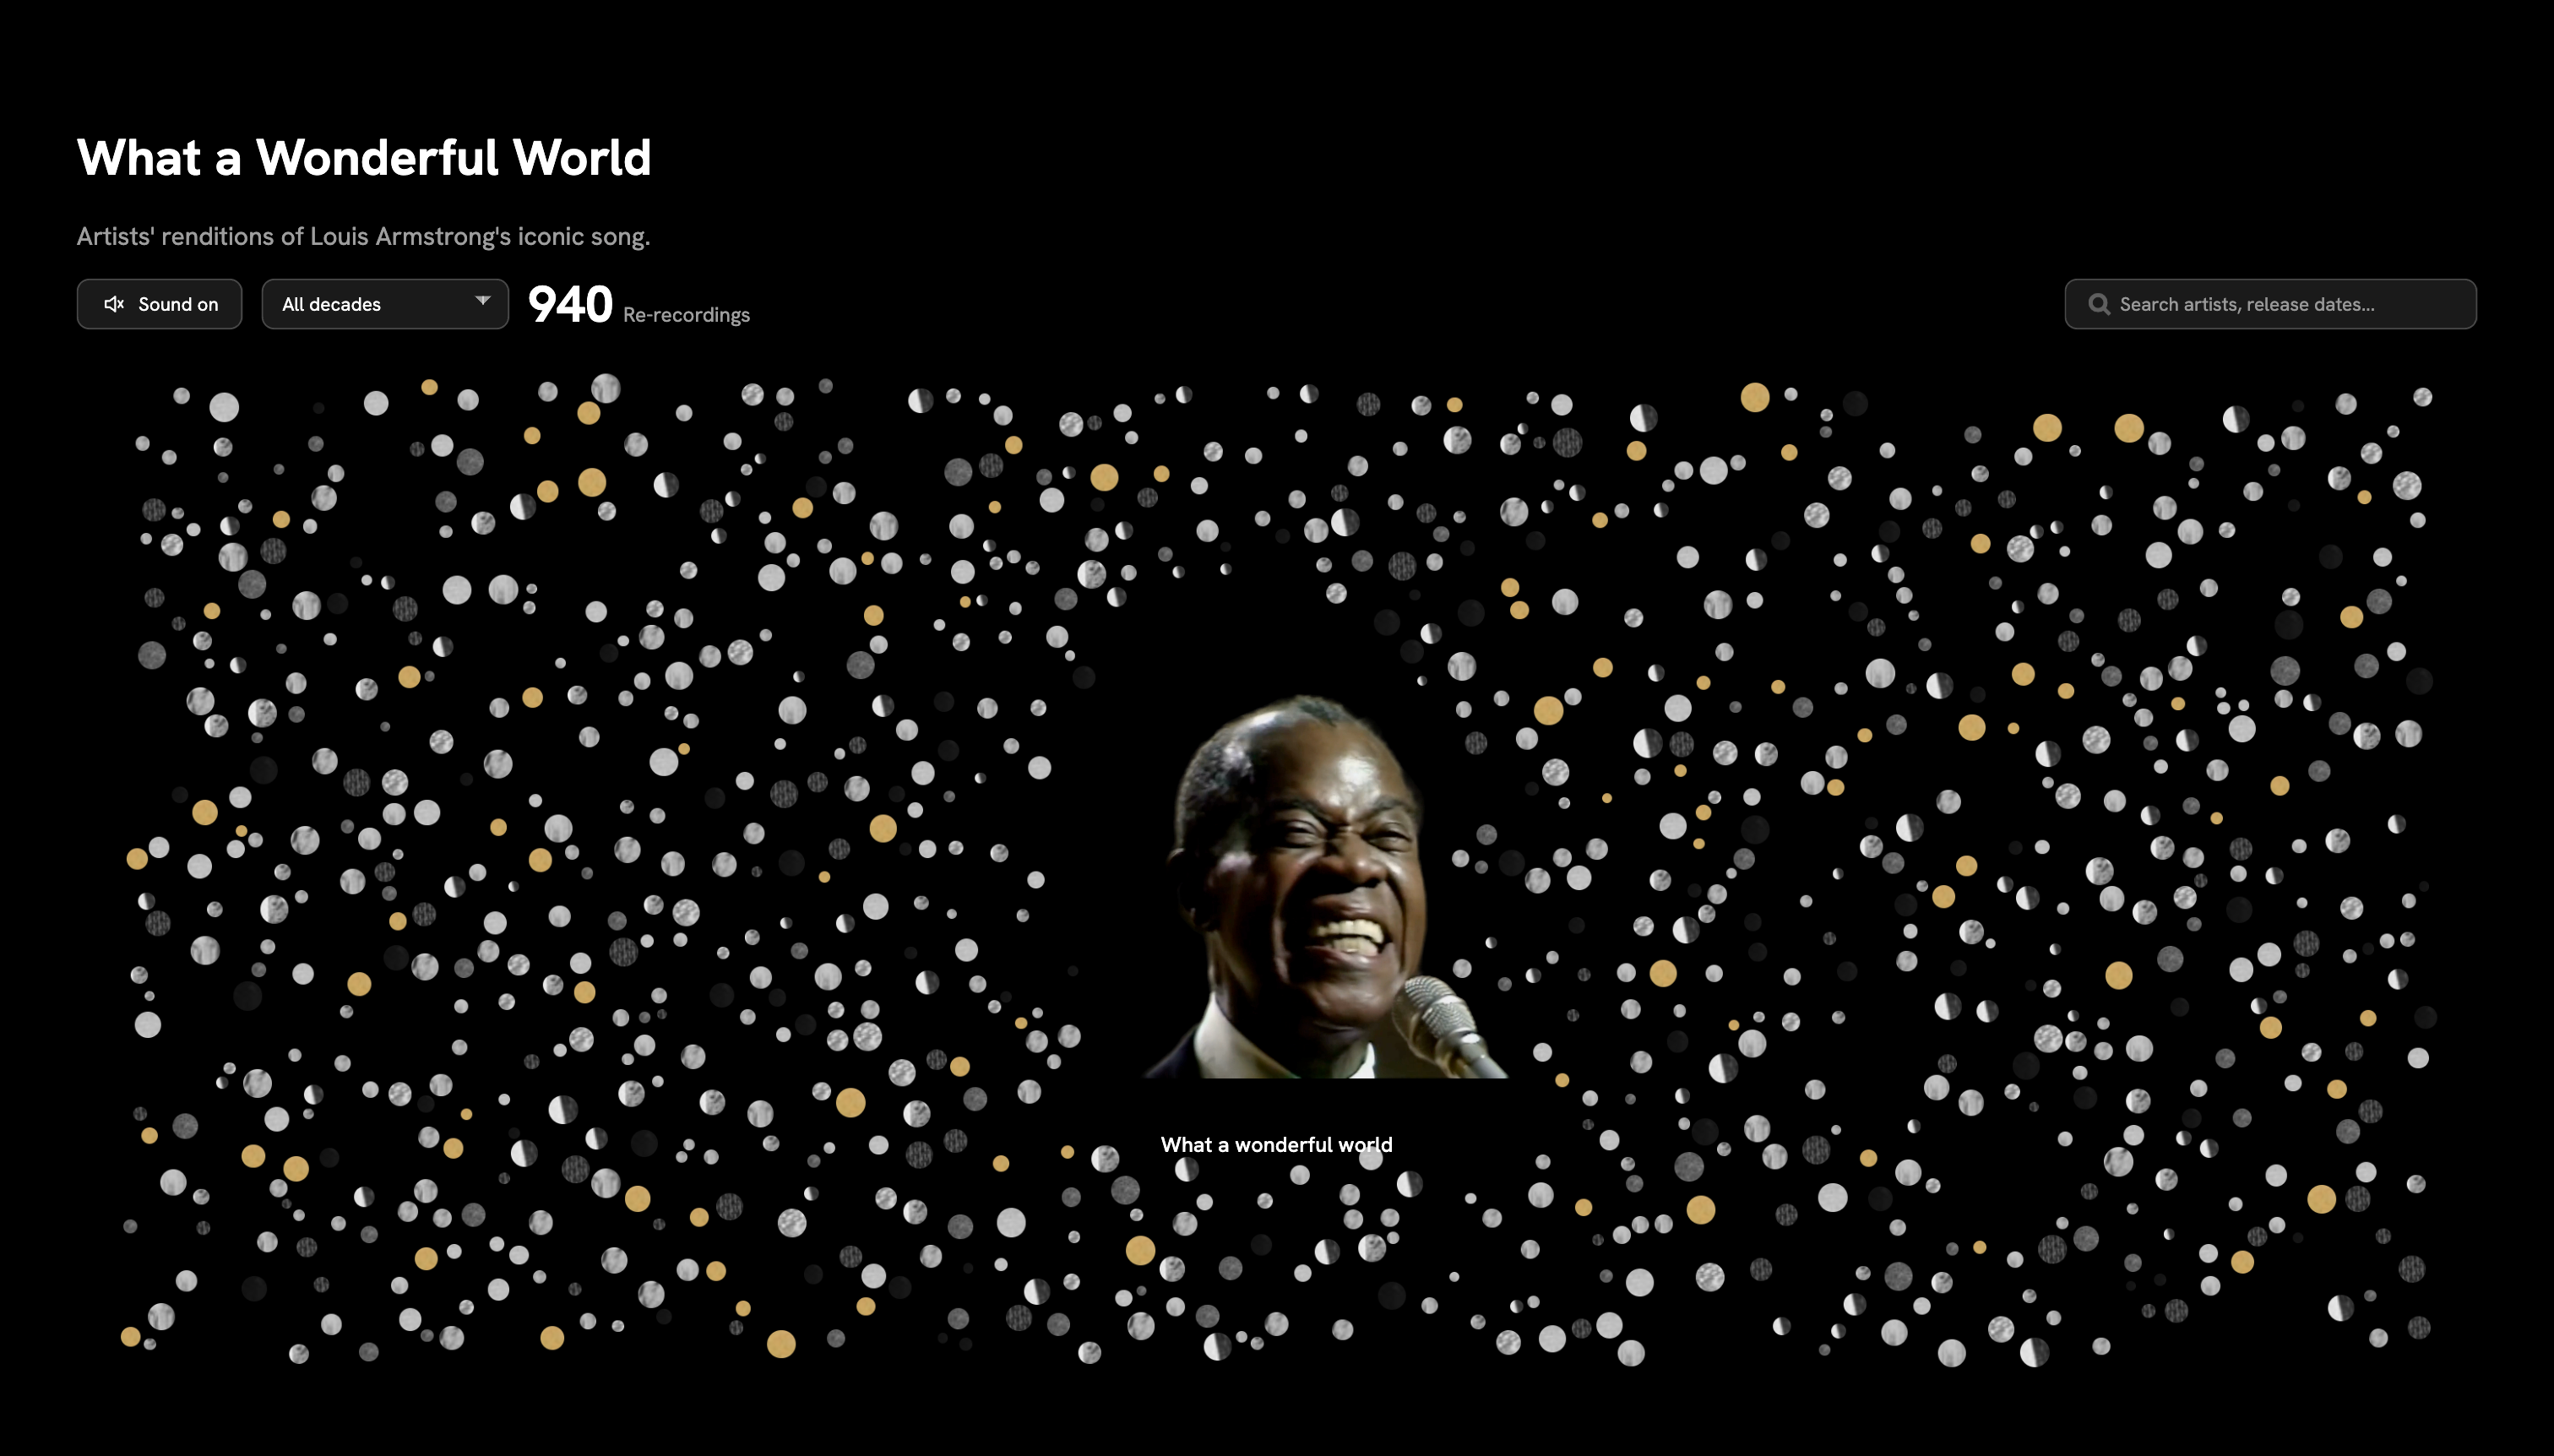
How one song was re-recorded and reinterpreted across generations.
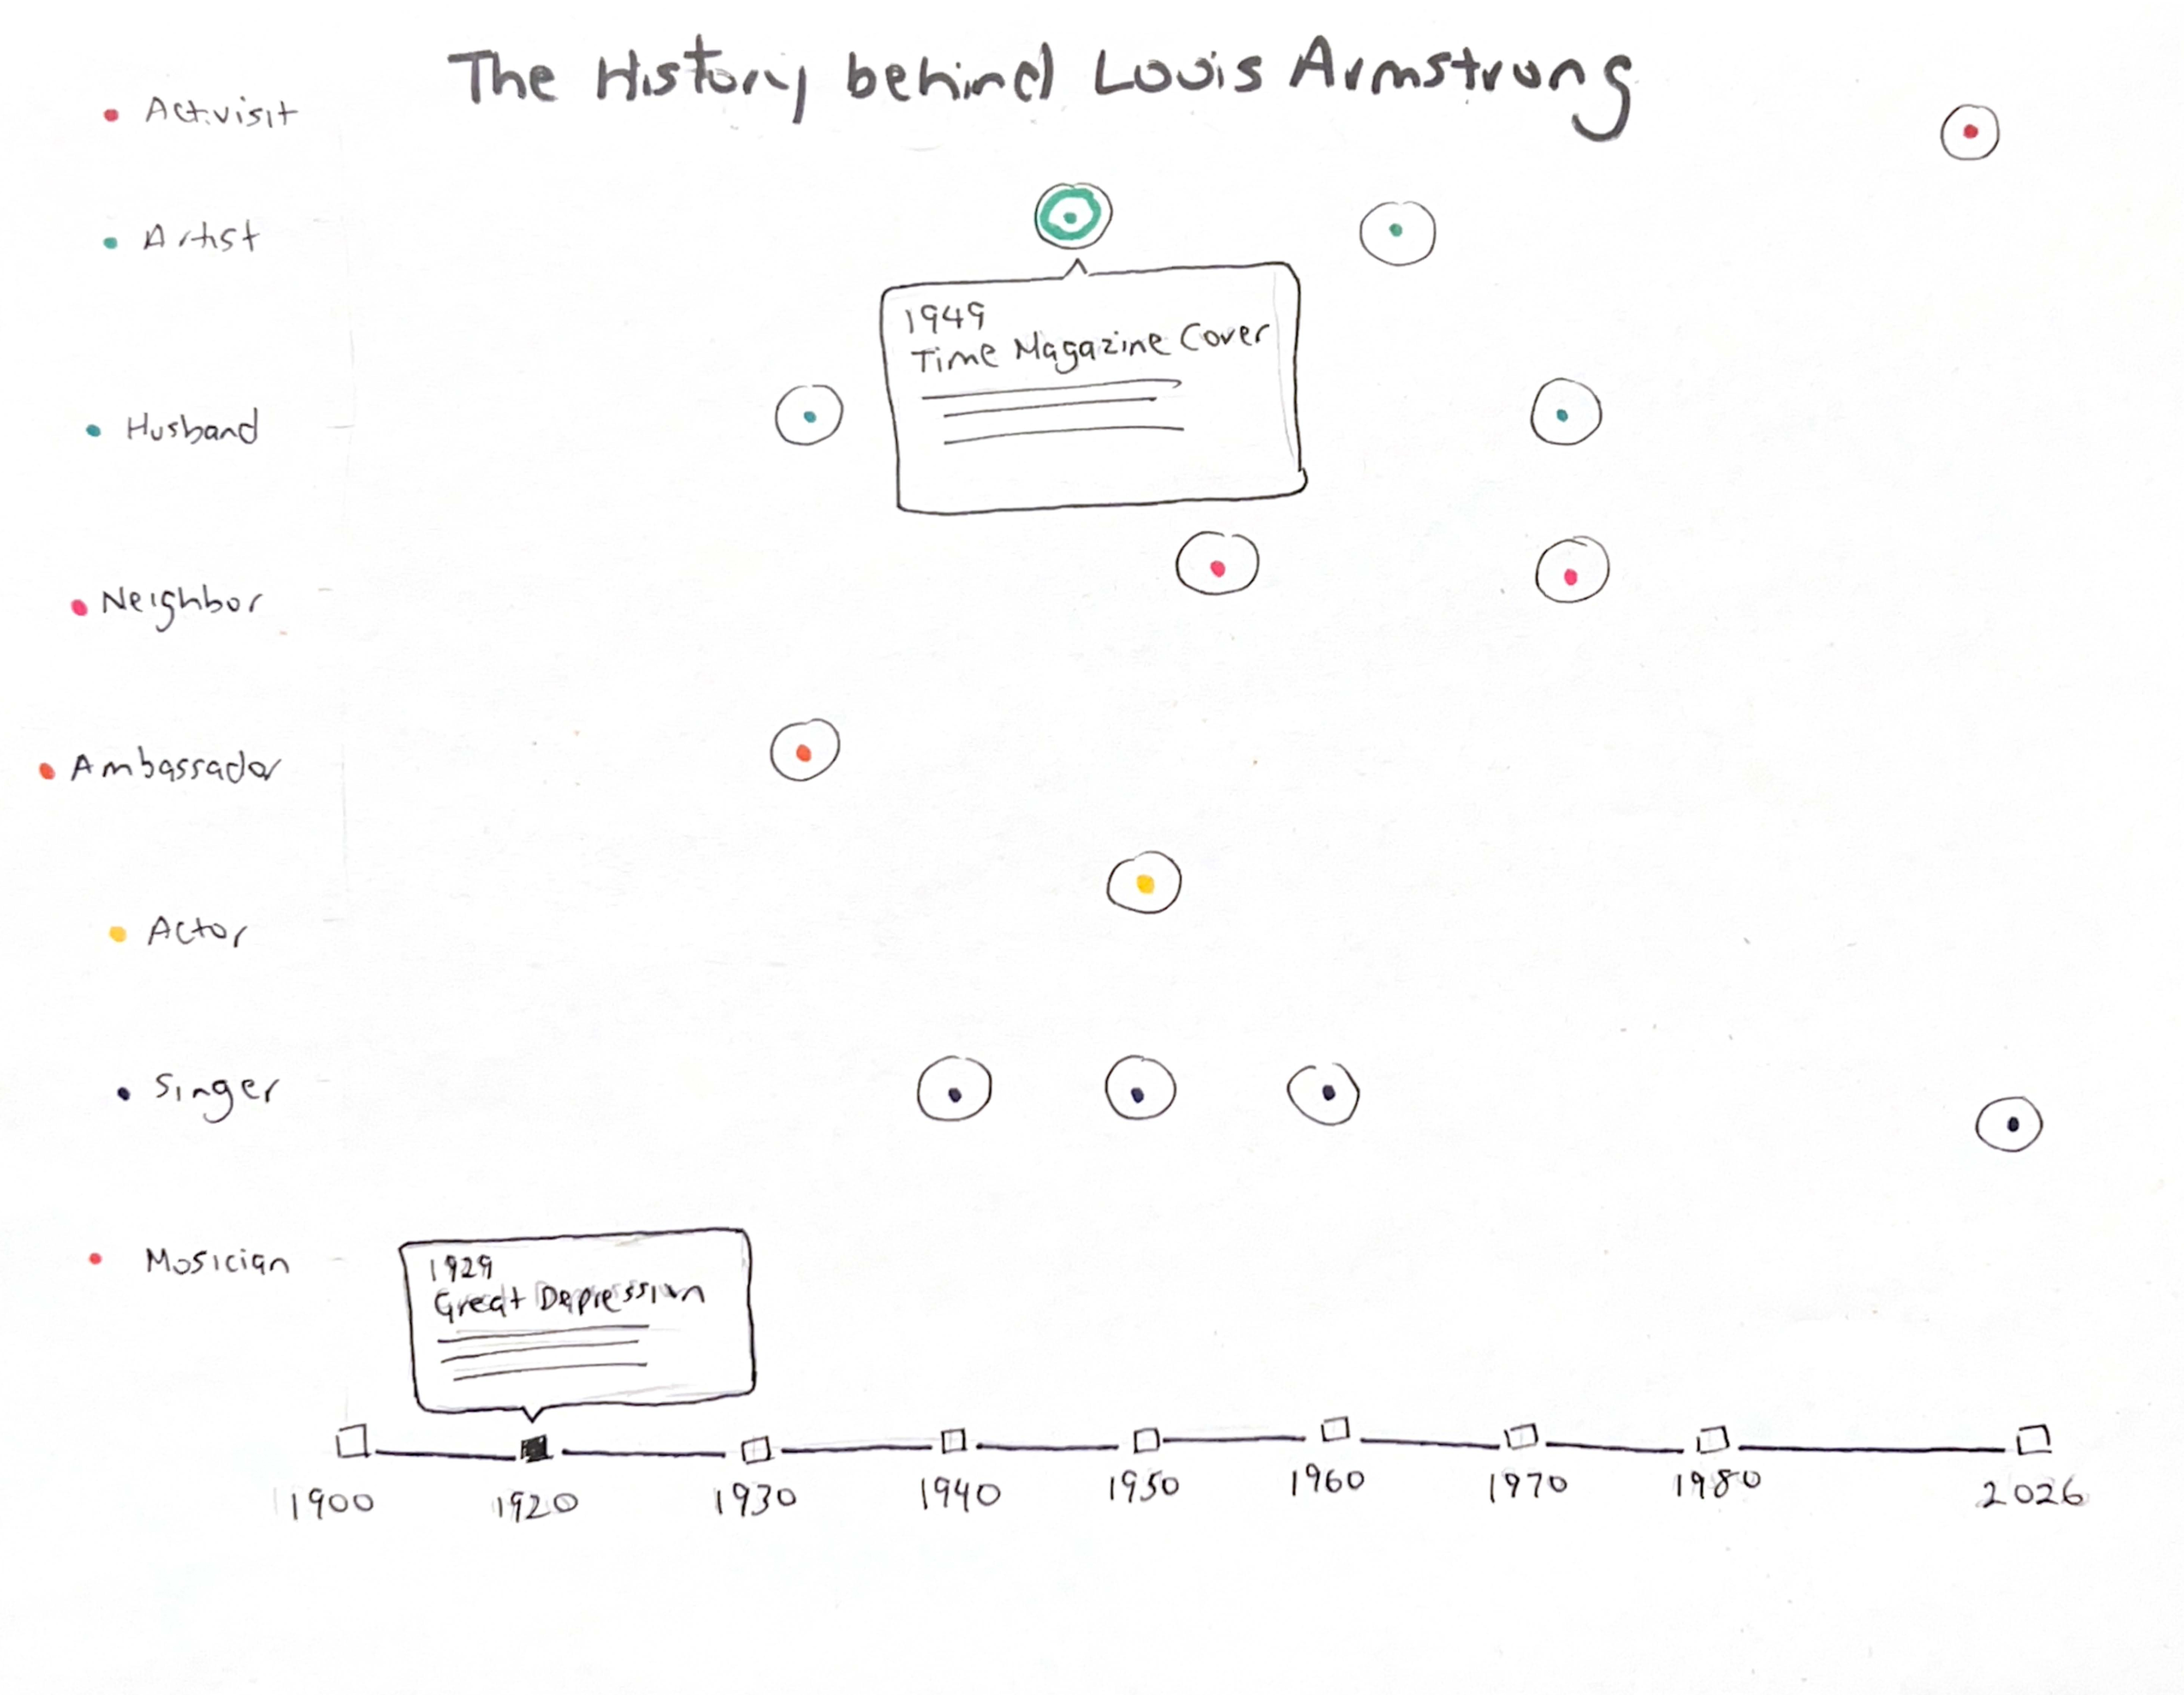
Timeline Sketch
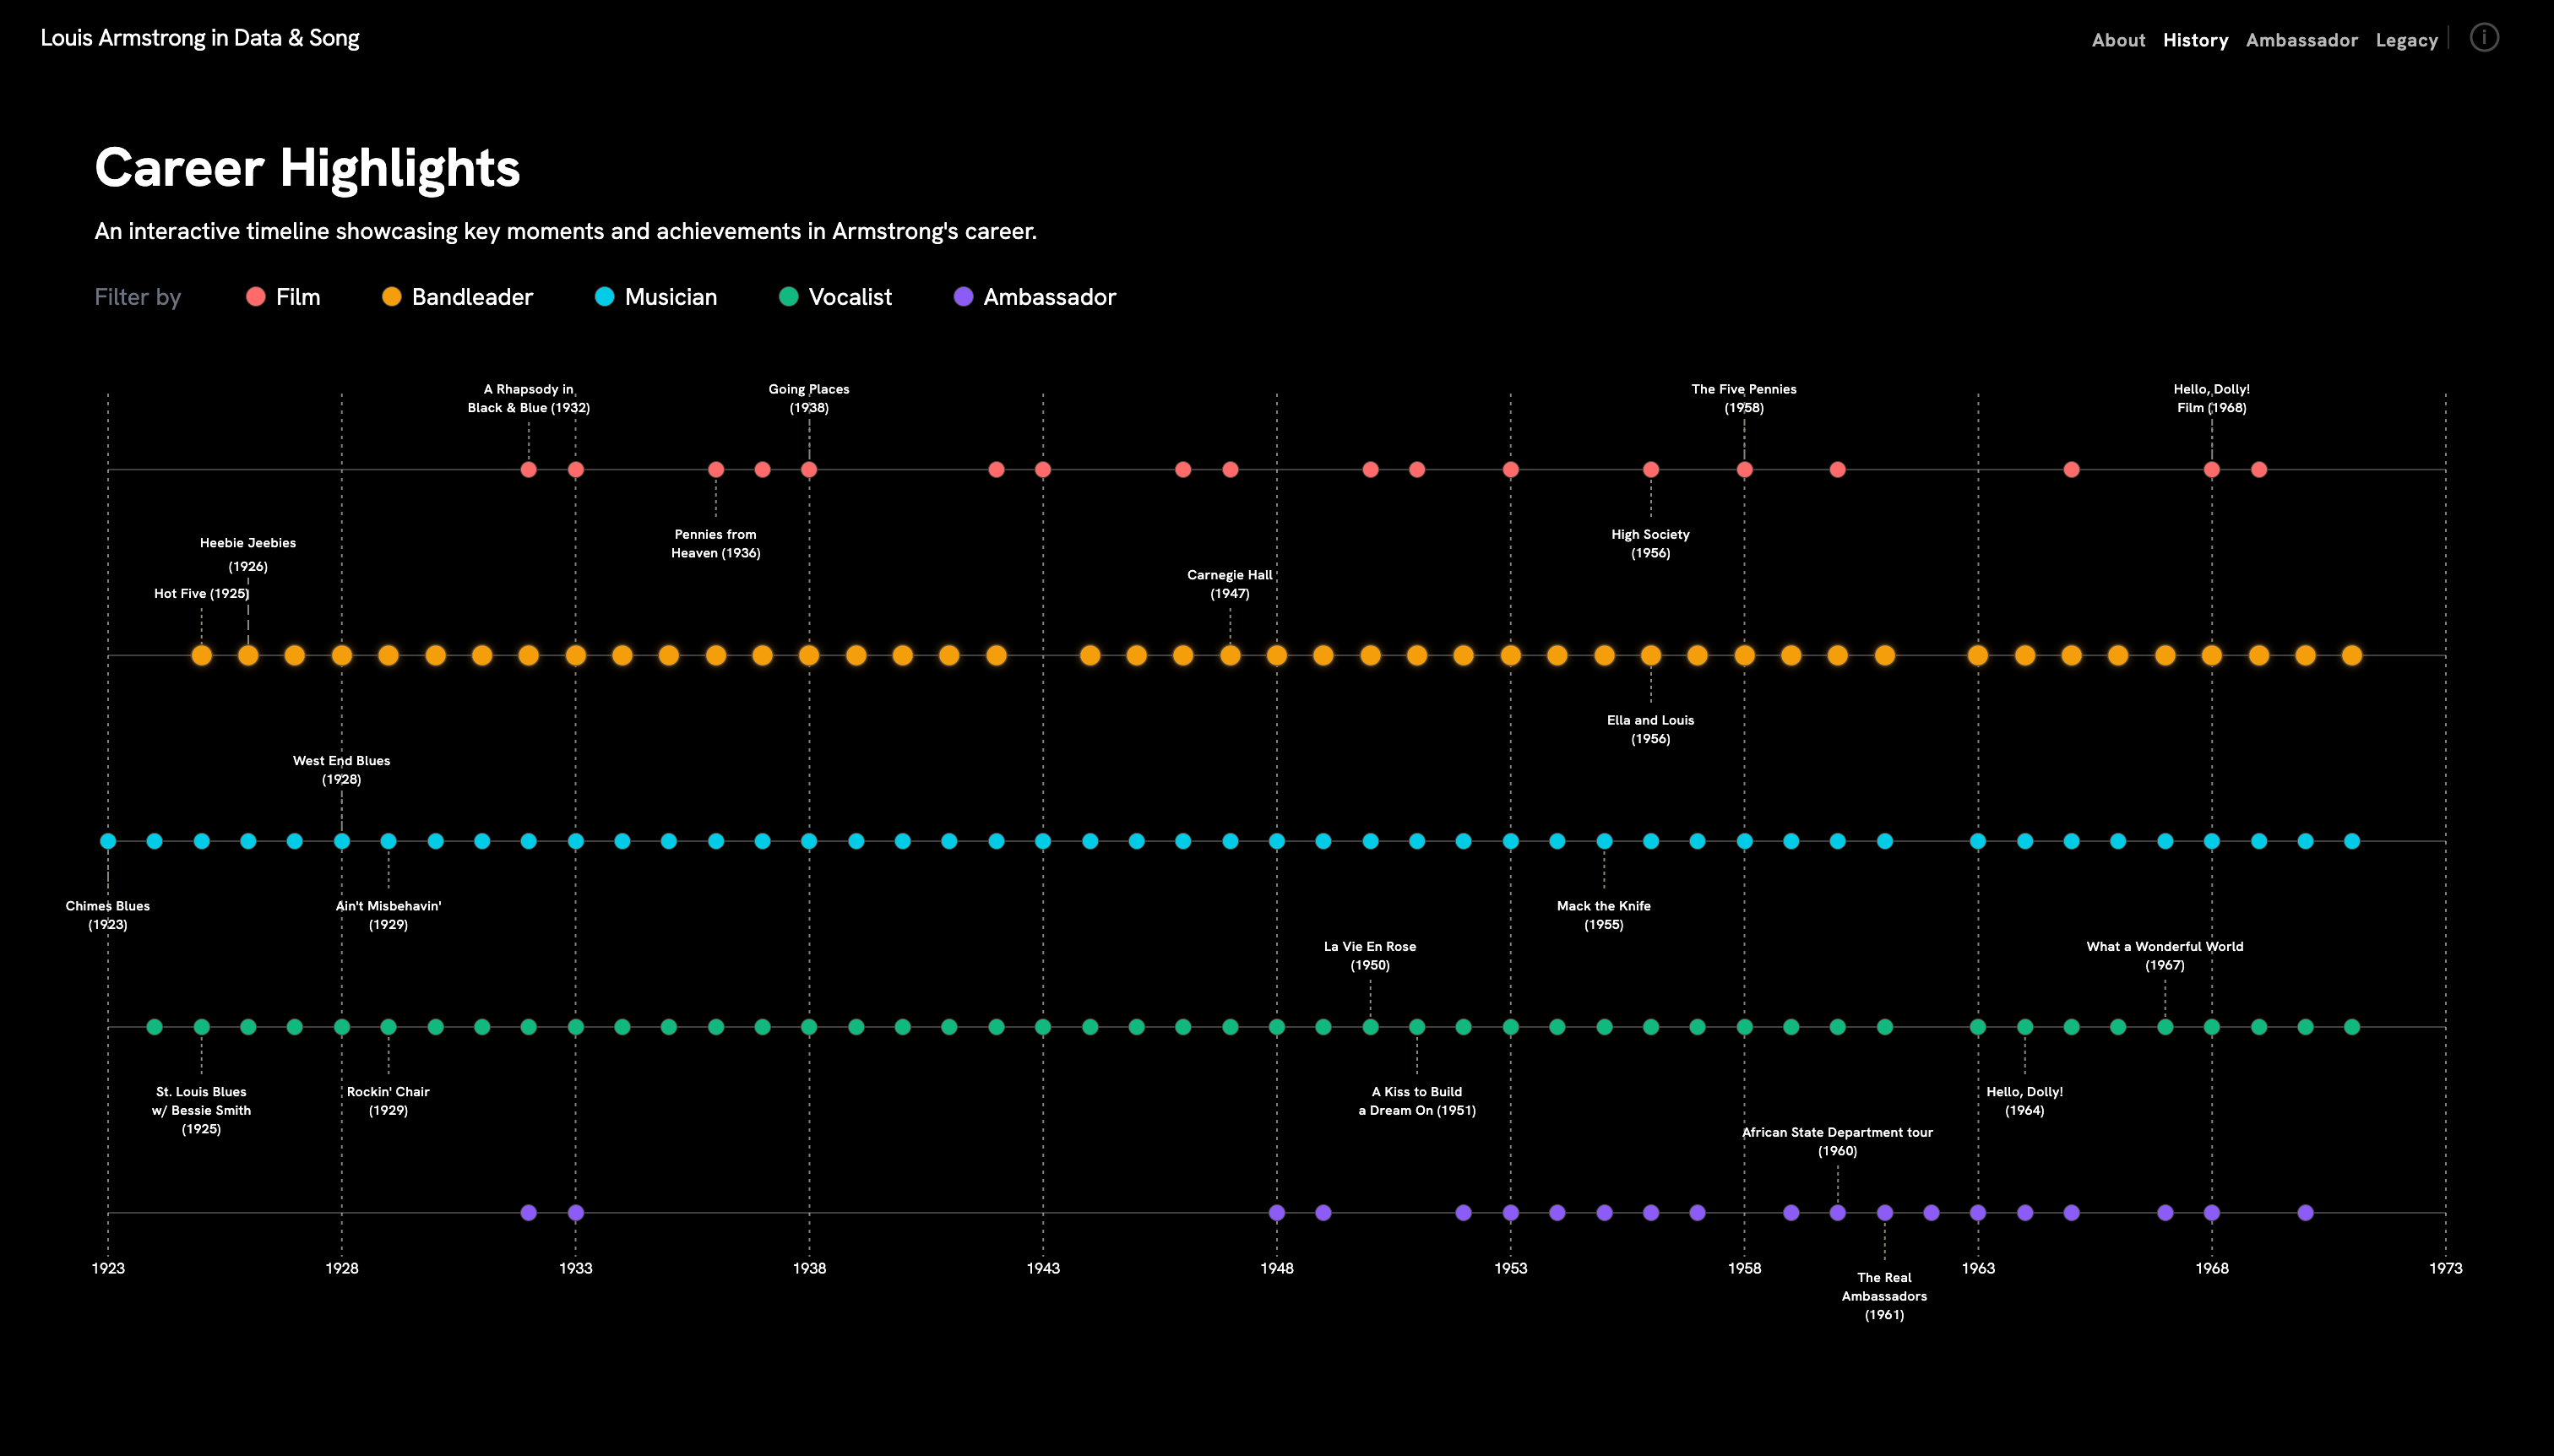
Decades of recordings, and the career inflection points that shaped his reach.
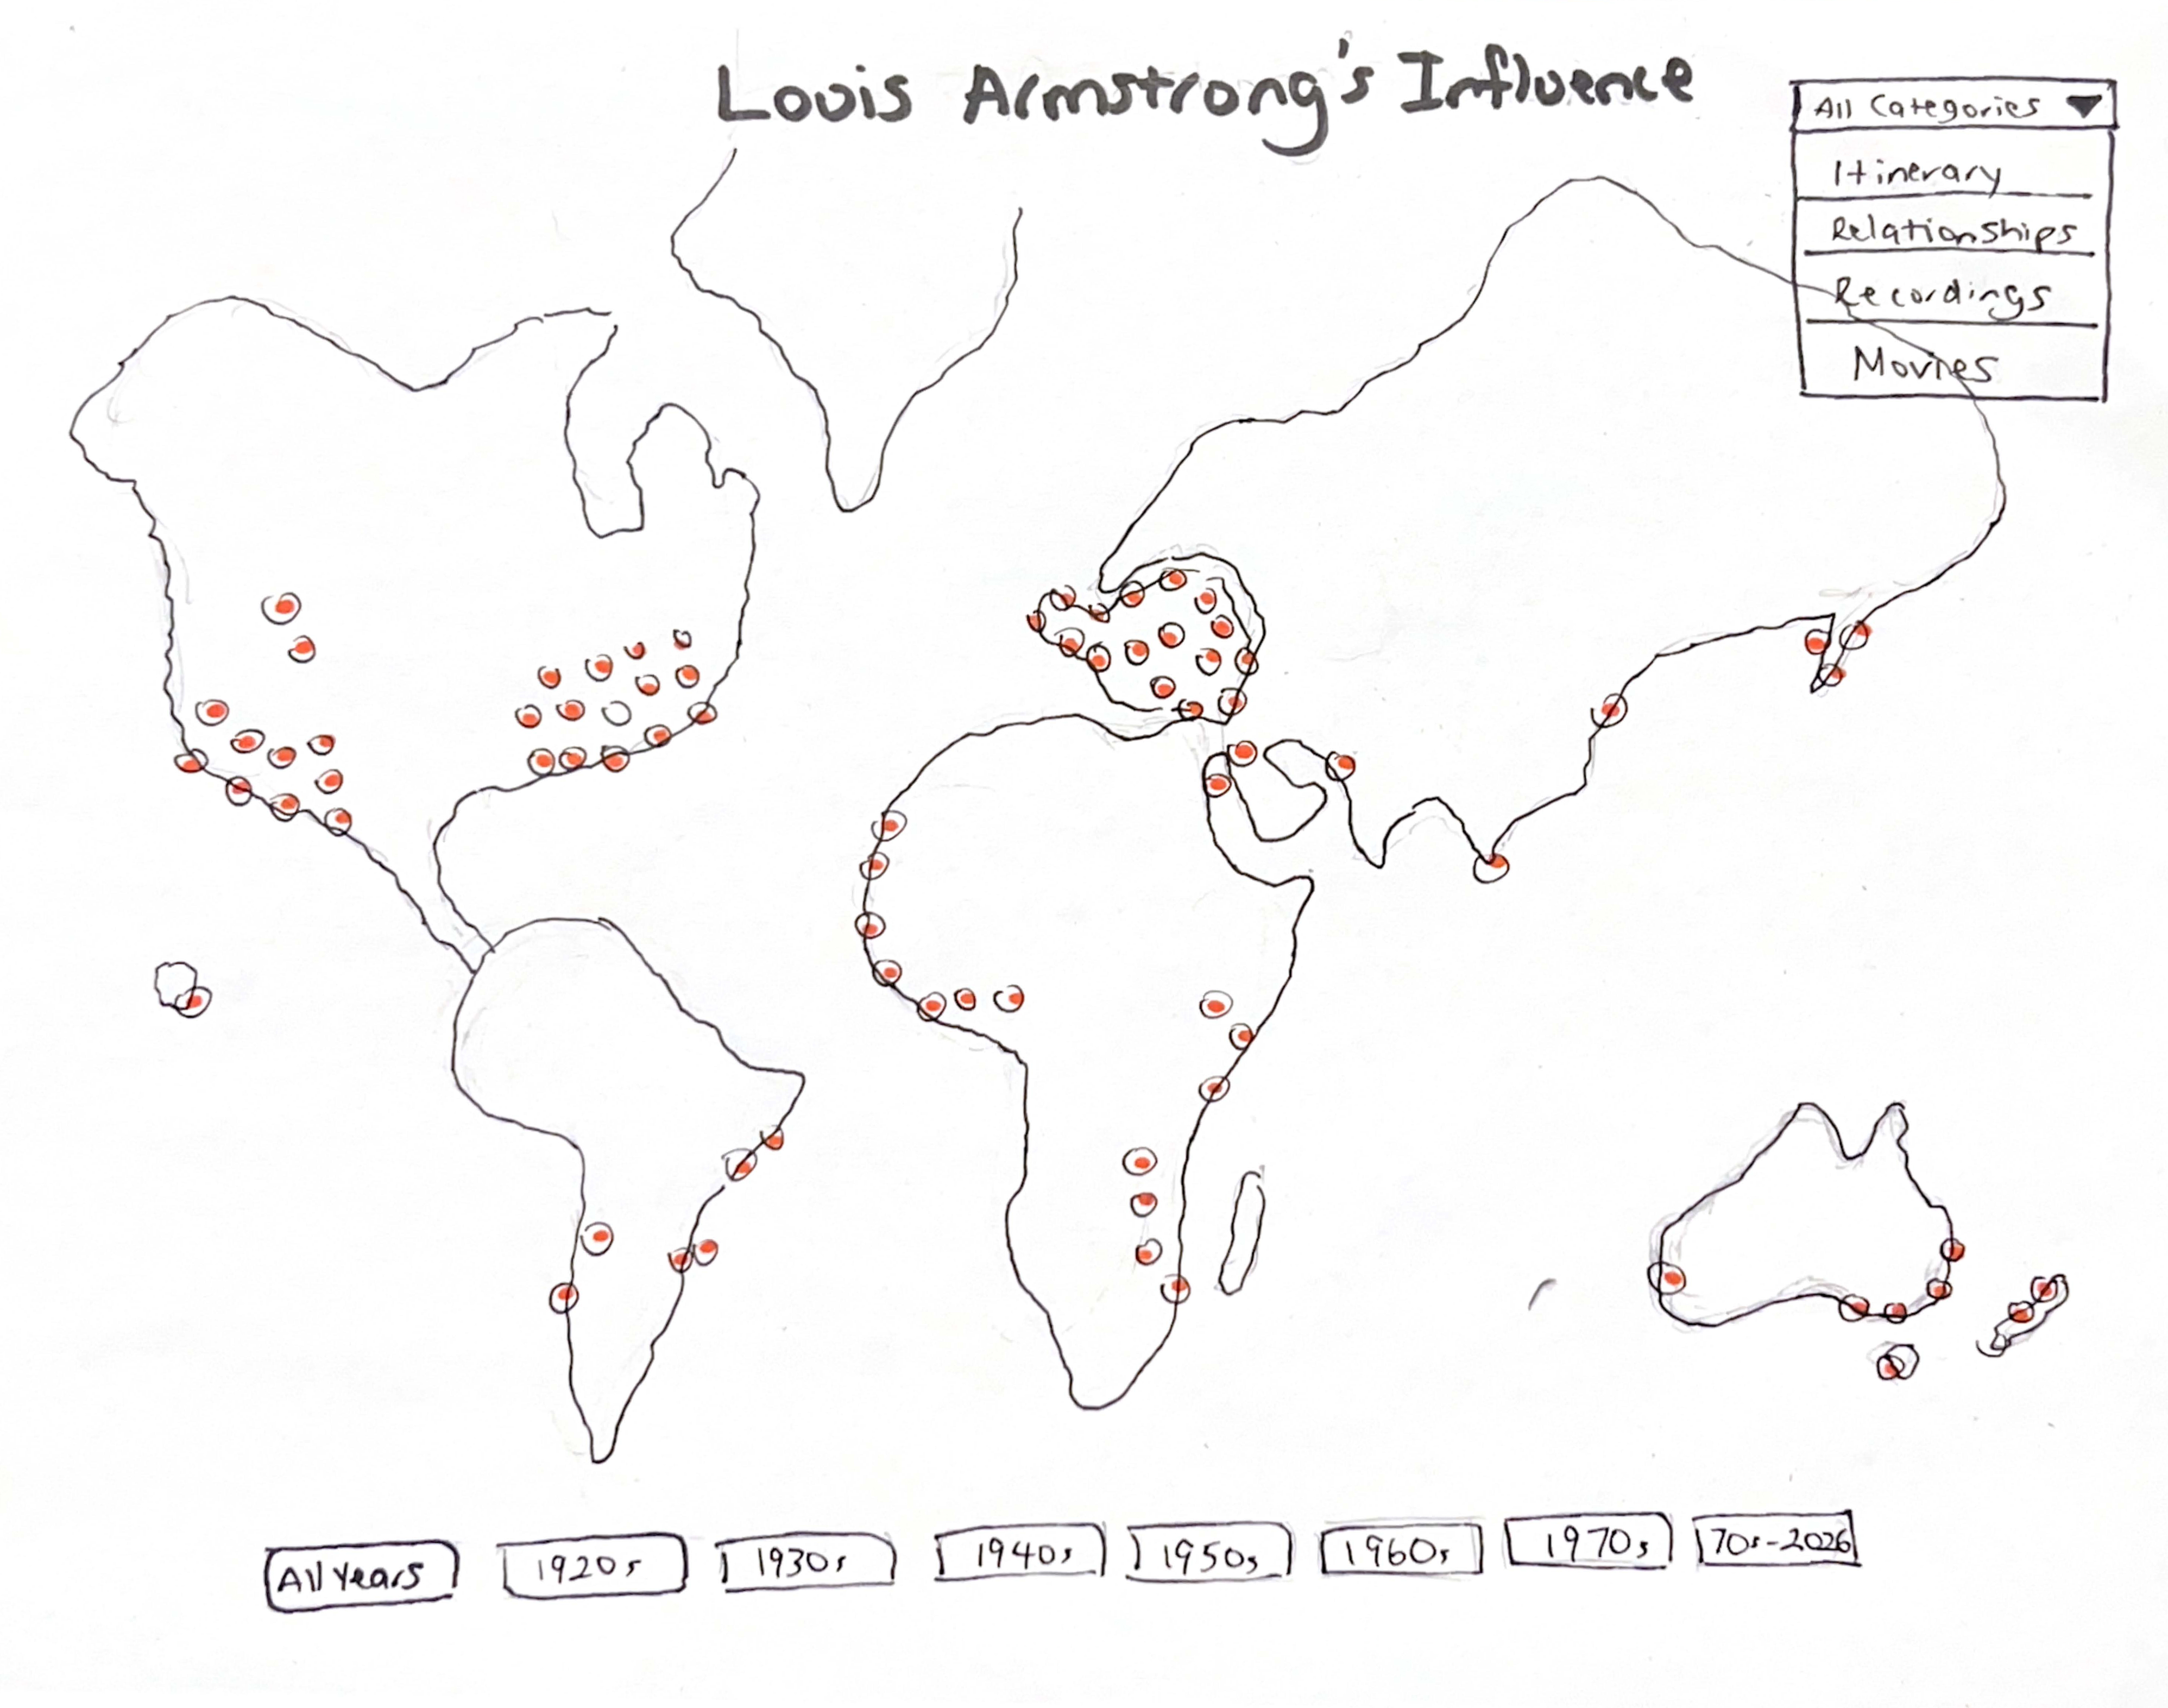
Map Sketch
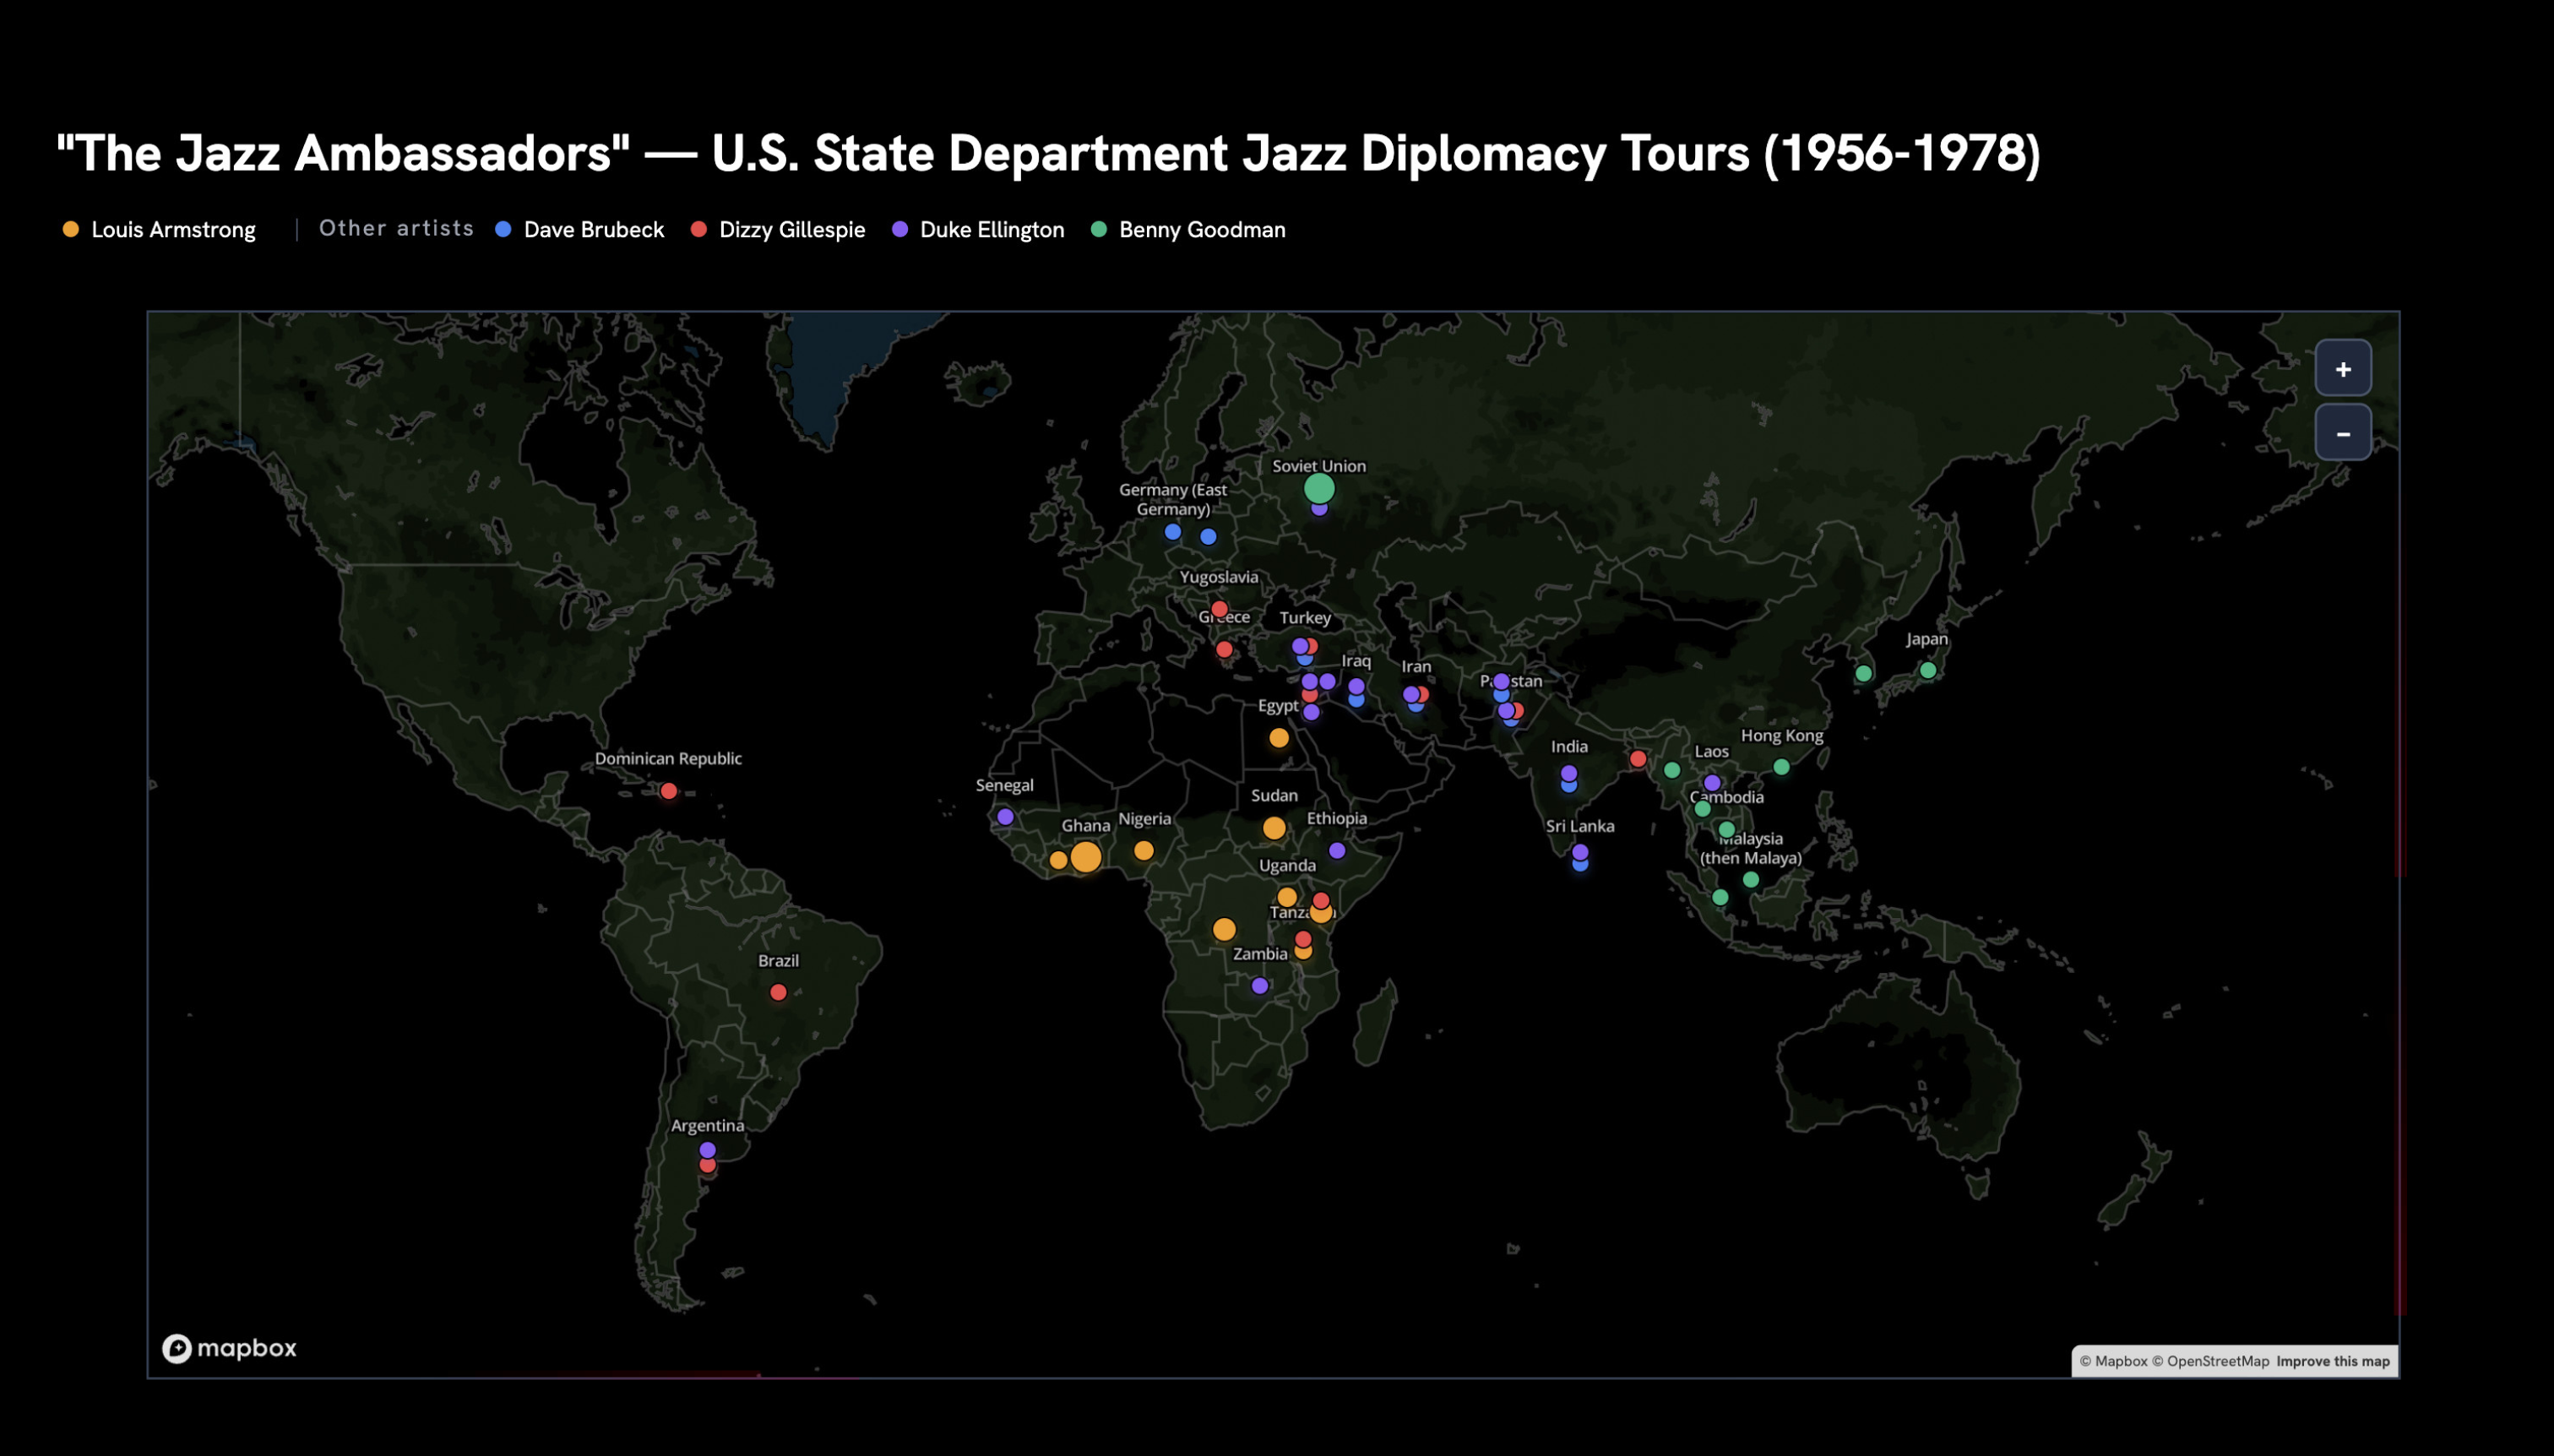
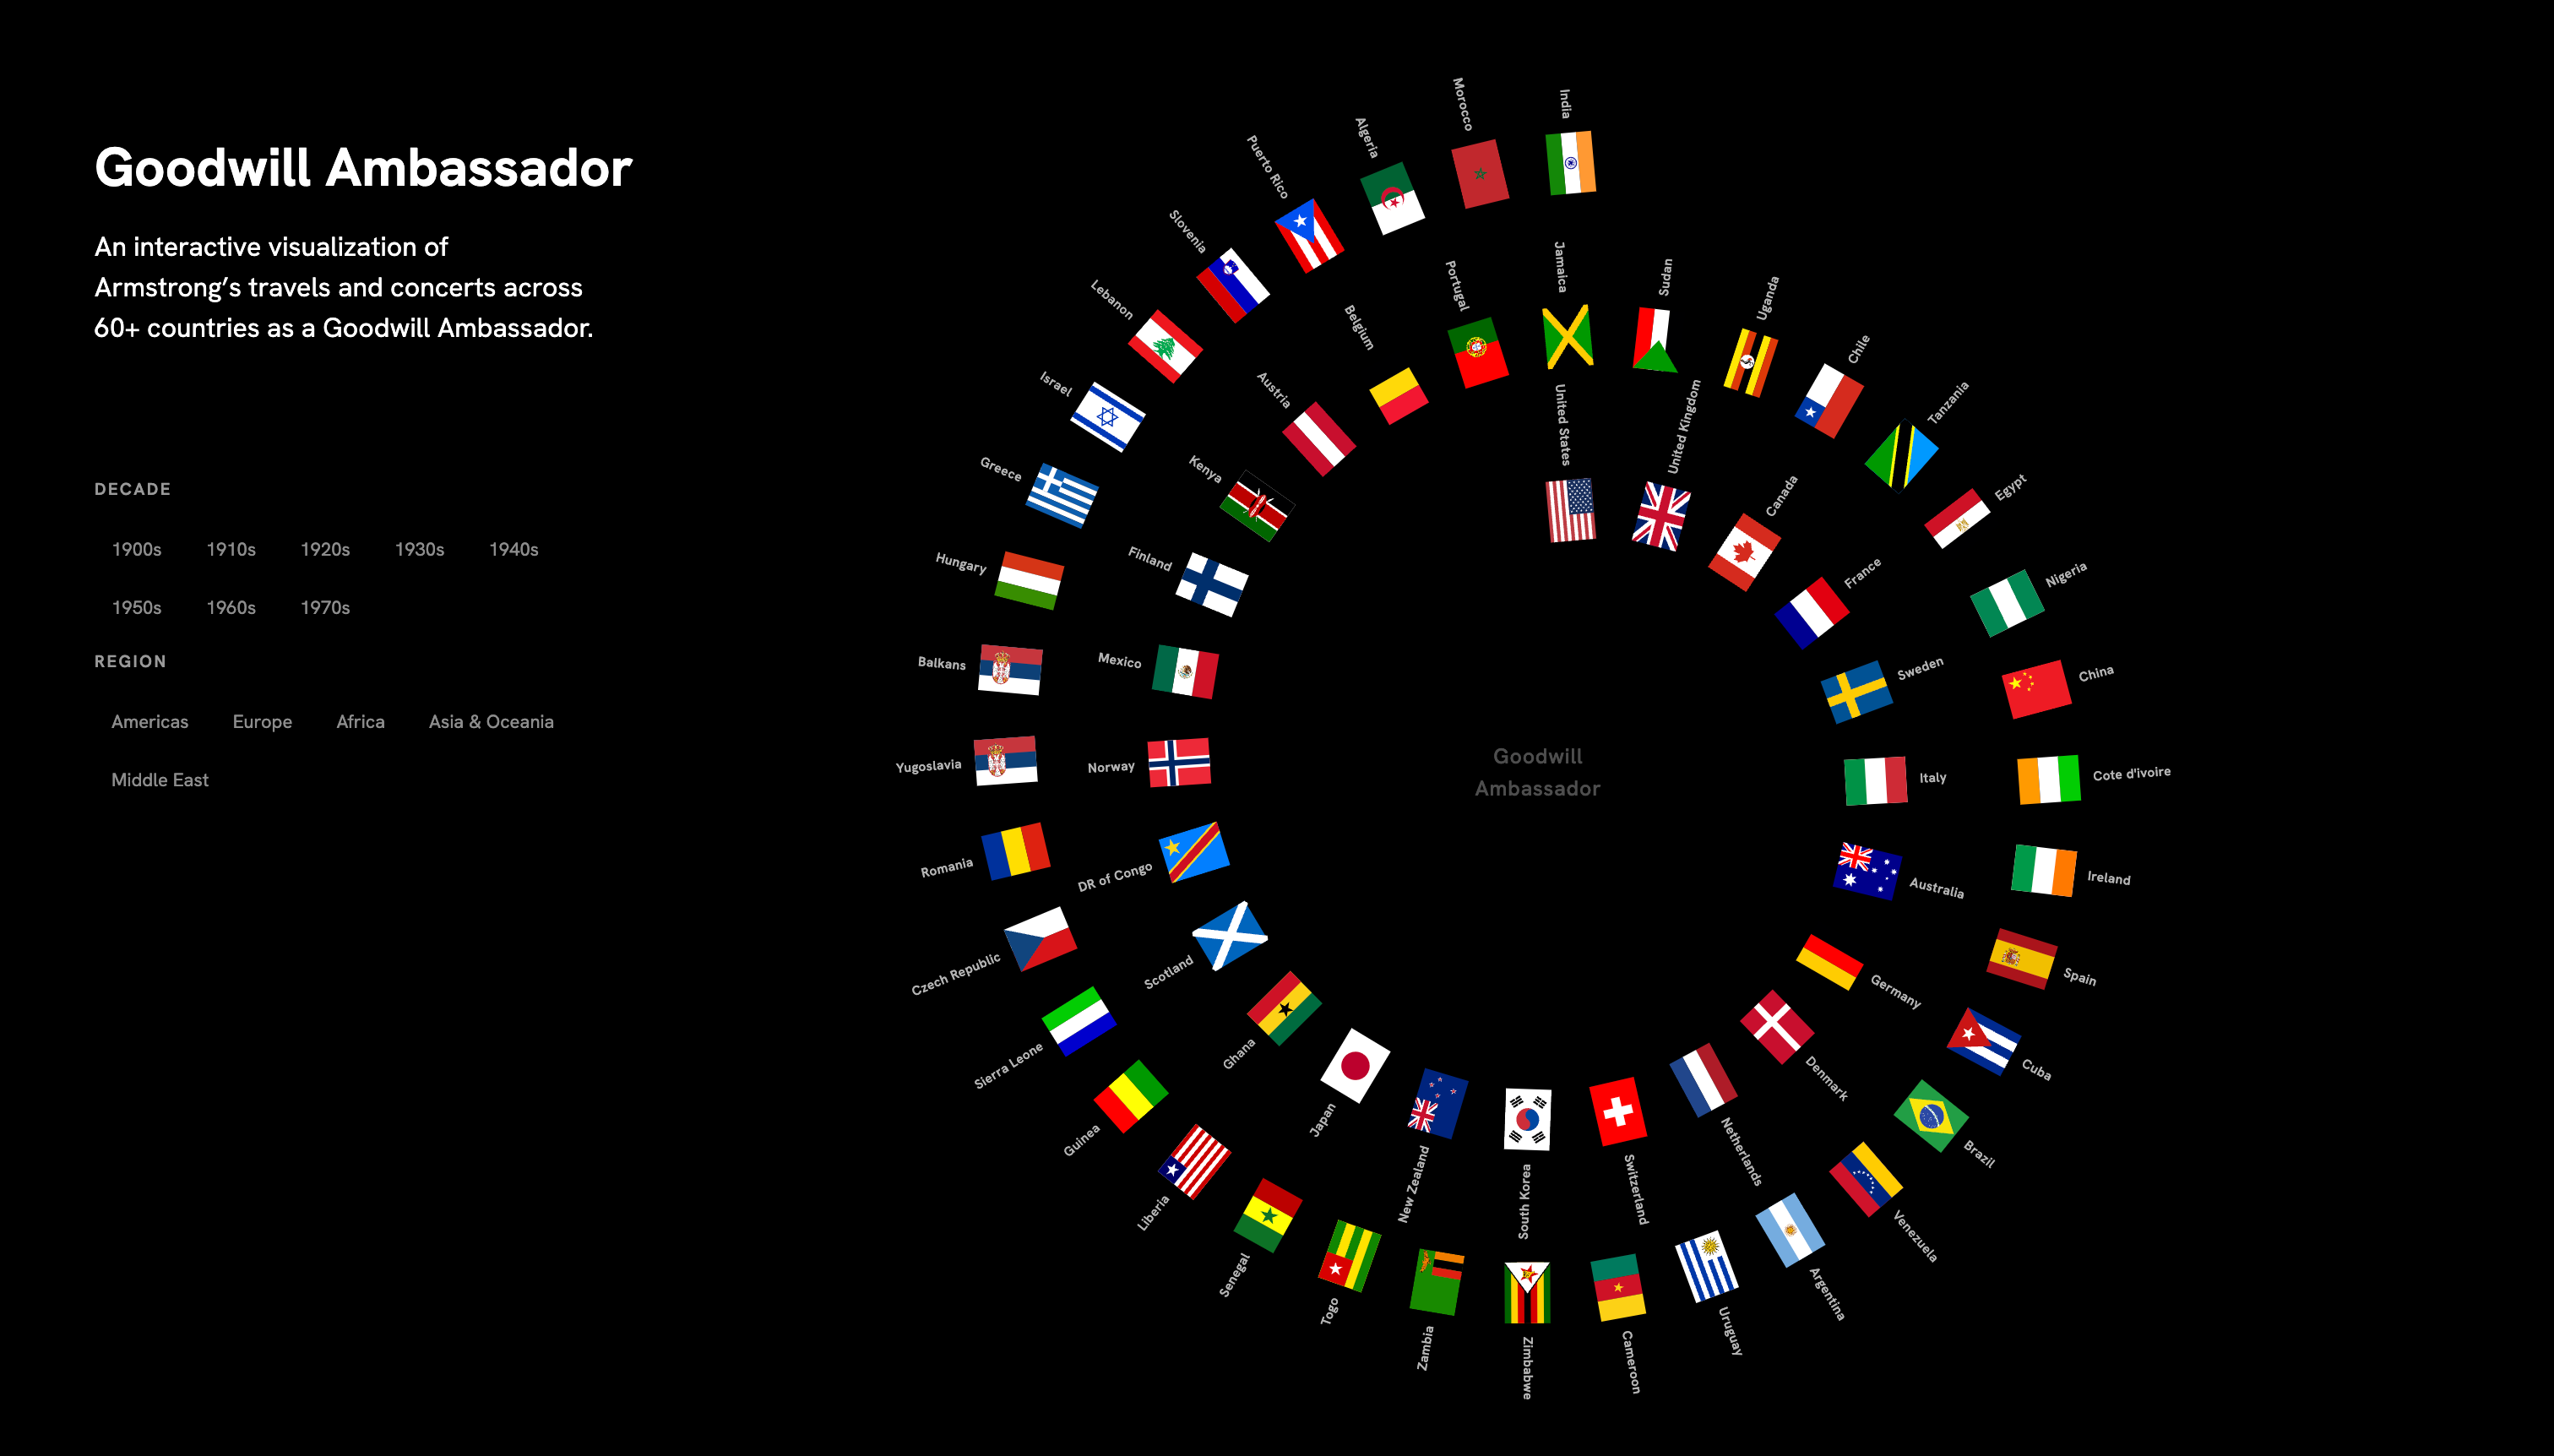
The State Department sent Armstrong and other jazz artists abroad as ambassadors of American culture — jazz as diplomacy.
Expanding the Story
Unexpected stories that emerged from the data
The deeper I went into the data, the more stories surfaced that deserved their own view. Several visualizations that weren't part of my original plan made it into the final project, each one enhancing the narrative and revealing a facet of Armstrong's influence I hadn't anticipated at the beginning.
The countries Armstrong reached as America's jazz ambassador, official and unofficial, over a lifetime of touring.
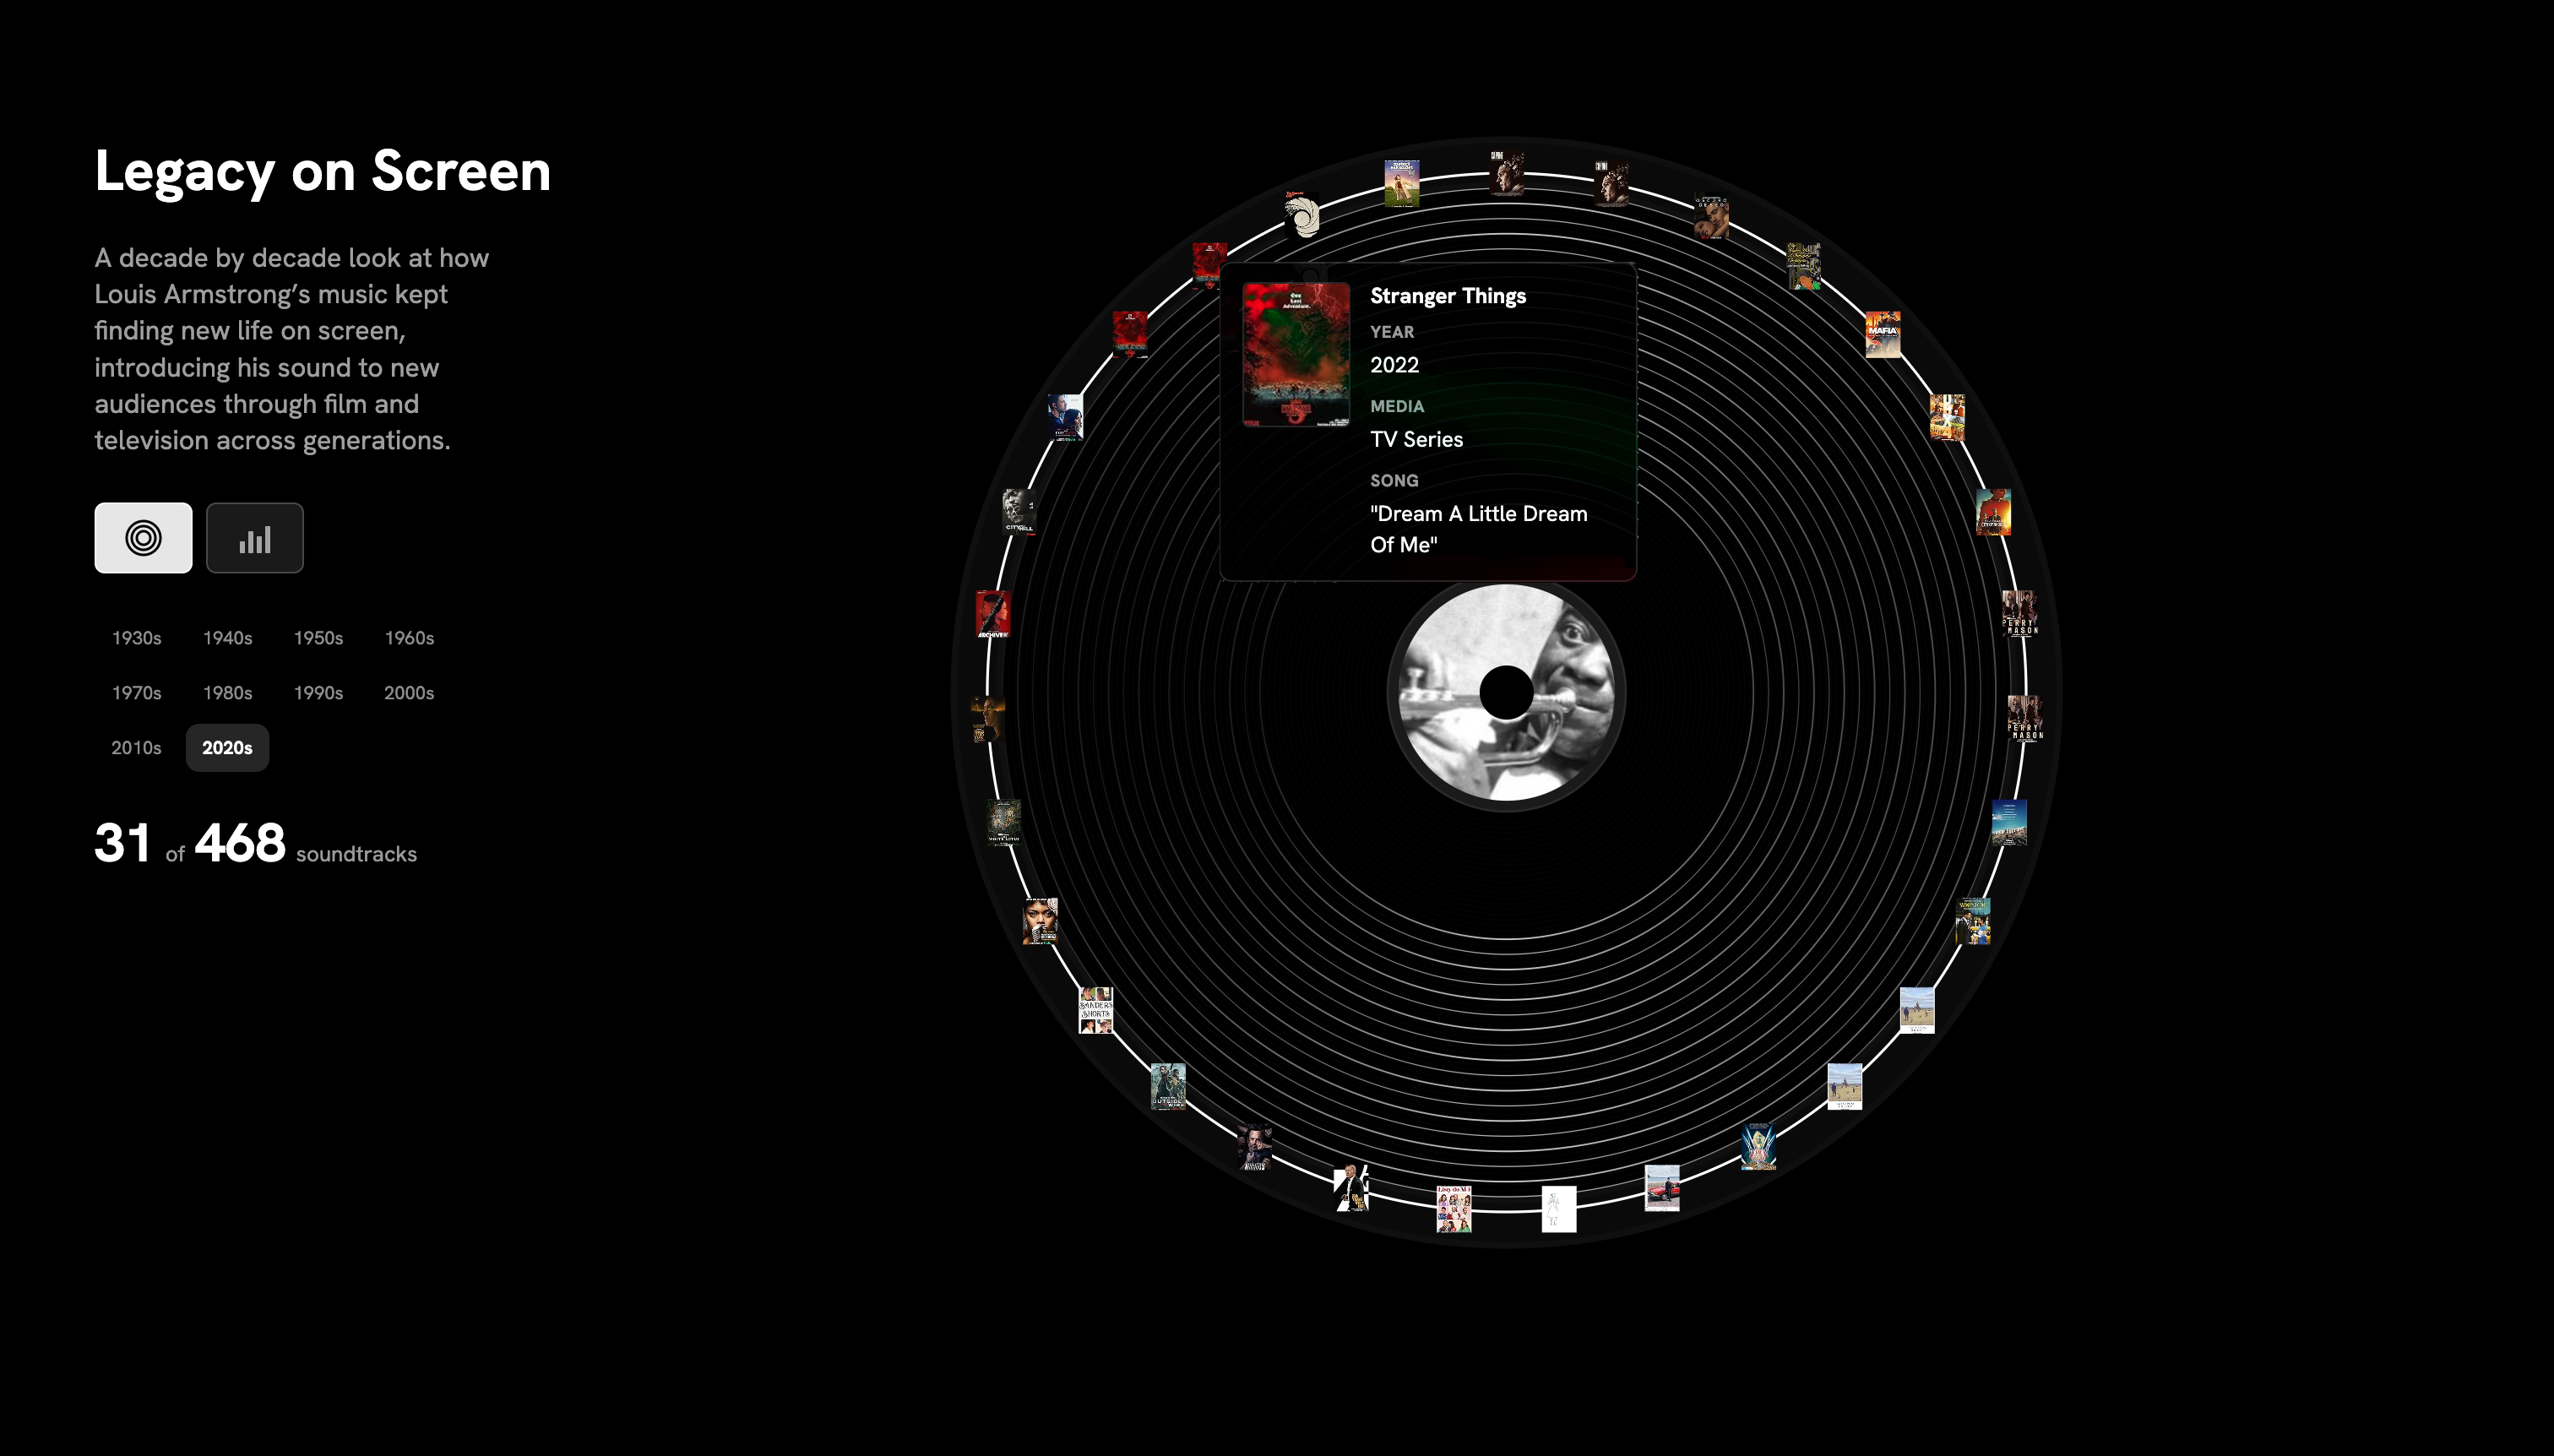
468 soundtracks and counting — how Armstrong's music lived on across film, television, and games, long after his death.
Reflection
Deciding what not to show
The hardest part of this project was deciding what not to show. Armstrong's archive is vast, and every dataset opened more questions. Working weekly with the Museum's historians taught me to let the historical argument drive the visualization rather than the reverse: each visualization was included if it advanced the thesis. That discipline shaped every decision, from which chart type to use or customize to what got left out.
Presented at the 2026 Keynotes at Parsons School of Design (with audio narration)
What the Data Revealed
His global reach was the story I told
The scale of Armstrong's reach became the argument. Sixty countries toured as a cultural ambassador. 468 soundtracks and counting. 940 re-recordings of "What a Wonderful World" most of them decades after his death. All told, he wasn't just a musician who happened to travel, he was a cultural institution the United States sent abroad, and whose work kept circulating long after he stopped recording. Laid out as data, Armstrong is reframed from entertainer to architect of how the world came to hear America.
The project was presented at the 2026 Parsons Data Visualization Keynotes and celebrated by the Louis Armstrong House Museum.
Clickable iframe — the full archive, and filters